Whats new in Policy Reporter
Table of Contents
- Foreword
- Introduction
- Policy Engine Support
- Multi Cloud & Multi Tenancy Features
- Metric Customization
- Observe blocked requests
- High Available Setup
- Policy Reporter CLI
- Security Improvements
- Policy Reporter in action
- Conclusion
Foreword
A lot has happened since I developed Policy Reporter for over a year and released it as an open-source project. With the donation to the Kyverno organization, adoption grew continuously and it steadily received important feedback.
Policy Reporter has grown with the help of this feedback and has seen important improvements. In this blog post, I'd like to share the latest and most important of these enhancements and features in specific use cases to provide an overview of the functionality and potential to improve your security monitoring.
Introduction
Policy Reporter adds observability and monitoring possibilities to your cluster security based on the PolicyReport CRD, introduced by the Kubernetes Policy Working Group and used by security tools like Kyverno.
It processes each (Cluster)PolicyReport resource in the cluster and checks each update for new violations, to send them to configured targets like Grafana Loki, Slack, MS Team and more. It also provides metrics and a flaible REST API about your PolicyReportResults.
The REST API is used by the optional Policy Reporter UI, a standalone NuxtJS based dashboard that provides different views about the current status of your PolicyReportResults. Different filters and groupings helps you to find the information you are interested in.

Links
Policy Engine Support
Although in most cases Policy Reporter is used together with Kyverno, it is not limited to it. Since the PolicyReport CRD is a generic CRD for different types of policy engines, it supports any tool that supports it directly or indirectly. Over the last year not only Policy Reporter has evolved, but also the mentioned support for the PolicyReport CRD has grown and so it is possible to visualize PolicyReportResults from tools like Falco, Kube Bench, Trivy (Operator), Tracee, jsPolicy and of course Kyverno in the same dashboard.
The integration of these tools varies and depends on the type of support, for PolicyReports. Some have native support and some require additional tools/adapters and setup. I will provide some links to check the different integrations.
Example
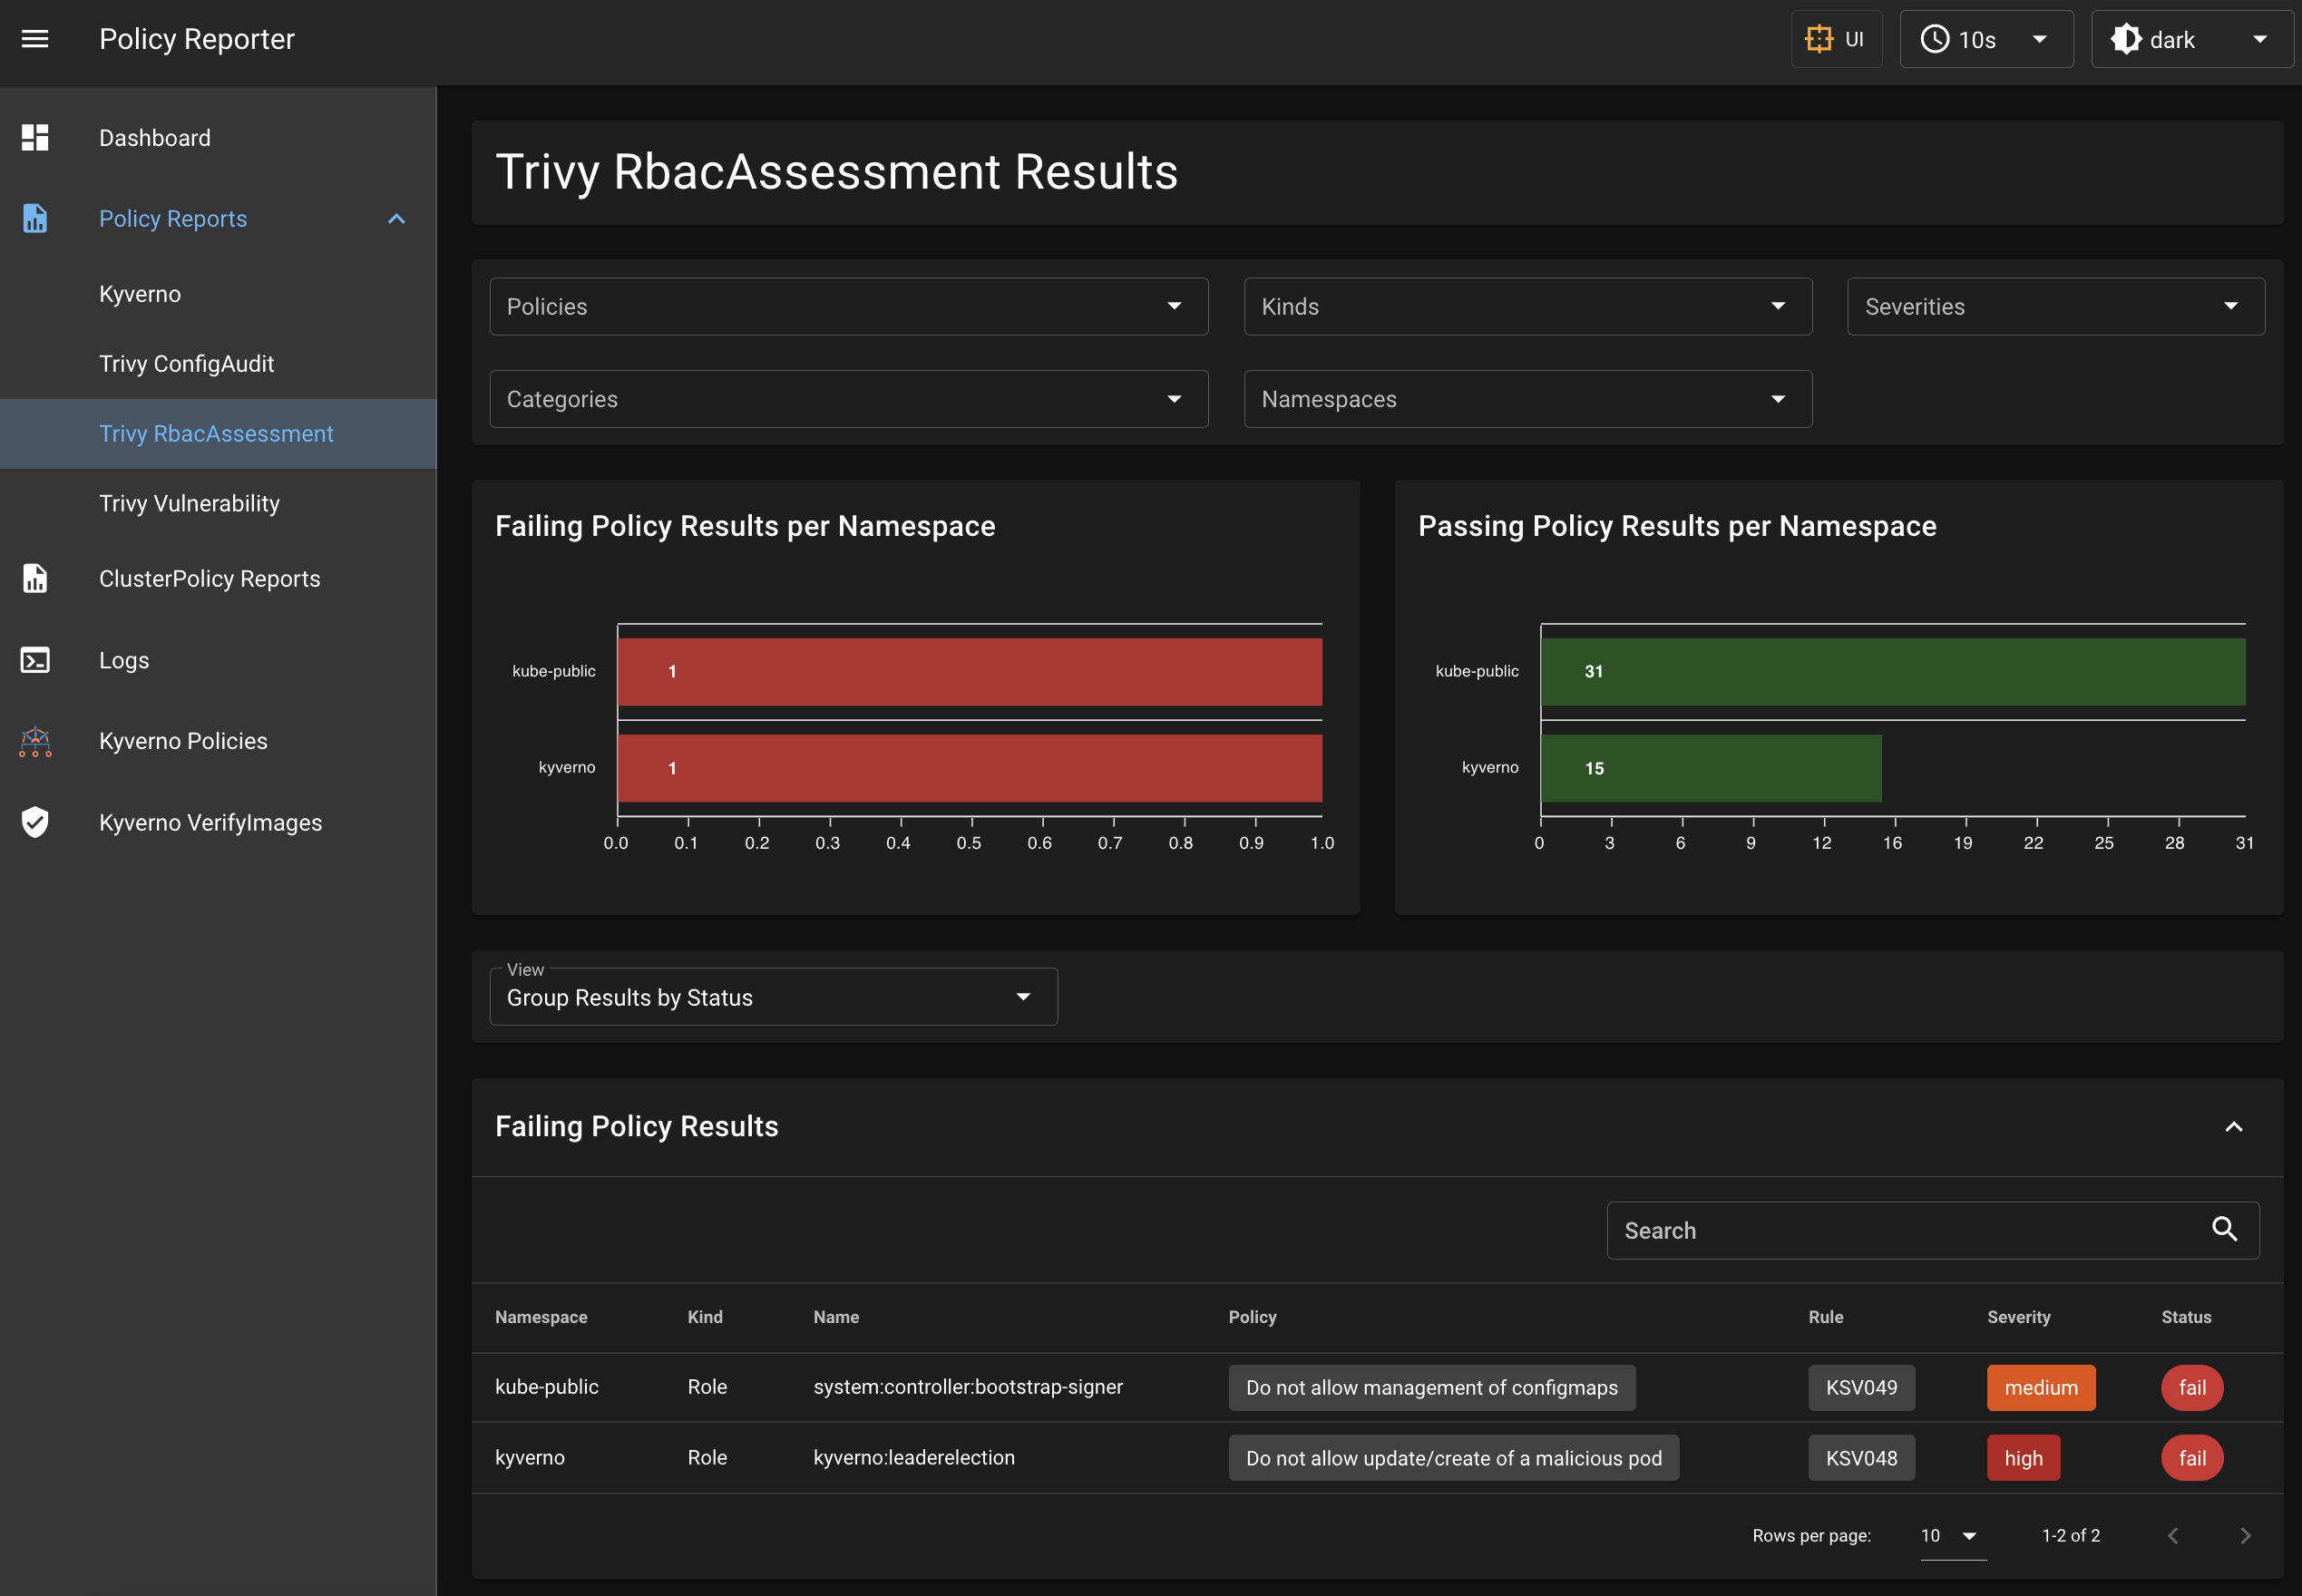
The following screenshot shows a Policy Reporter UI setup with integration of Kyverno and the Trivy Operator CRDs.
Links
- Kyverno - Reporting
- Falco Adapter | Falcosidekick
- Kube Bench Adapter
- Trivy Adapter
- Trivy Operator PolicyReport Adapter
- Tracee PolicyReport Adapter
- ckotzbauer/vulnerability-operator
Multi Cloud & Multi Tenancy Features
Today, it is very common for organizations to run multiple clusters and have different teams responsible for specific namespaces or projects within a cluster. Policy Reporter provides a number of new features to accommodate these different responsibilities and reduce the effort required to switch between multiple clusters.
Target Channels and Filters
One of the first features of Policy Reporter was the aggregation of various notification to push to tools like Slack, Discord or Grafana Loki. Thus, it was only possible to configure a single message channel or instance, with no restrictions on the notification sent. This leads to several challenges in a multi-tenancy cluster, such as unexpected security breach notifications that you shouldn't see or don't care about.
In version 2.5.0 of Policy Reporter, the channel and filter features for targets were introduced to solve this problem. With the channels, the possibility of configuring multiple push messages for the same type of targets was created. The filters in addition to the channels allow you to restrict the notifications to a channel based on namespace, policy, priority or source, where you can define either exclusion or inclusion rules.
Example
A common example, also shown in the documentation, are slack notifications. Imagine you have a product with a microservice architecture running in your cluster and different teams have dedicated responsibilities for a subset of the microservices. You don't want a single Slack channel for all new violations, because the teams are only interested in the violations related to the services they own. High frequency pushes about other parts of the product may annoy the developers and they start to ignore them in general.
With dedicated channels, restricted to the team namespaces, they only get pushes they are interested in and the frequency of pushes is also reduced to a minimum. You can also play with the priority filter to further reduce the pushes to really critical violations.
slack:
webhook: "https://hooks.slack.com/services/T0..."
  minimumPriority: "warning"
  skipExistingOnStartup: true
  channels:
  - name: Team A
    webhook: "https://hooks.slack.com/services/T1..."
    source: [Kyverno]
    filter:
      namespaces:
        include: ["finance", "subscriptions"]
  - name: Team B
    webhook: "https://hooks.slack.com/services/T2..."
    source: [Kyverno]
    filter:
      namespaces:
        include: ["email", "translation"]
The configuration above shows a central root channel for the infrastructure team, that will receive all violations with an priority of warning or higher. For our product teams we added two channels. The first channel for Team A is restricted to violations from Kyverno in the namespaces finance and subscriptions. For Team B we have a second channel with Kyverno violations for the namespaces email and translation.
In this setup we reduced the notifications for the teams by selecting the team specific namespaces, they will also only get notifications with a priority of warning or higher because this is inherited from the root configuration.
Links
E-Mail Reports
In addition to improving the multi-tenant user experience, email reports were introduced to simplify the use of Policy Reporter in a multi-cluster environment. The intent was to provide the operator with a daily overview of PolicyReportResults from all clusters with a different notification method.
You can choose between a summary report, with the number of result per status and source, or a violation summary with additional details about the failed results like resource, policy and rule. Both are implemented as CronJob with customizable schedule, and can be send as often as needed to a list of configured emails.
Example
As the operator of three clusters, I want to receive daily updates on the current status and violations of my Kyverno validation results for existing resources. To this end, I have installed Policy Reporter on each cluster and configured email reports for each of them to the same email address with a unique cluster name at 08:00 AM.
Production Cluster Configuration
emailReports:
  clusterName: Production
  smtp:
    host: smtp.server.com
    port: 465
    username: policy-reporter@company.org
    password: password
    from: policy-reporter@company.org
    encryption: ssl/tls
  violations:
    enabled: true
    schedule: "0 8 * * *"
    to: ['operator@email.com']
Development Cluster Configuration
emailReports:
  clusterName: Development
  smtp:
    host: smtp.server.com
    port: 465
    username: policy-reporter@company.org
    password: password
    from: policy-reporter@company.org
    encryption: ssl/tls
  violations:
    enabled: true
    schedule: "0 8 * * *"
    to: ['operator@email.com']
Playground Cluster Configuration
emailReports:
  clusterName: Playground Cluster
  smtp:
    host: smtp.server.com
    port: 465
    username: policy-reporter@company.org
    password: password
    from: policy-reporter@company.org
    encryption: ssl/tls
  violations:
    enabled: true
    schedule: "0 8 * * *"
    to: ['operator@email.com']
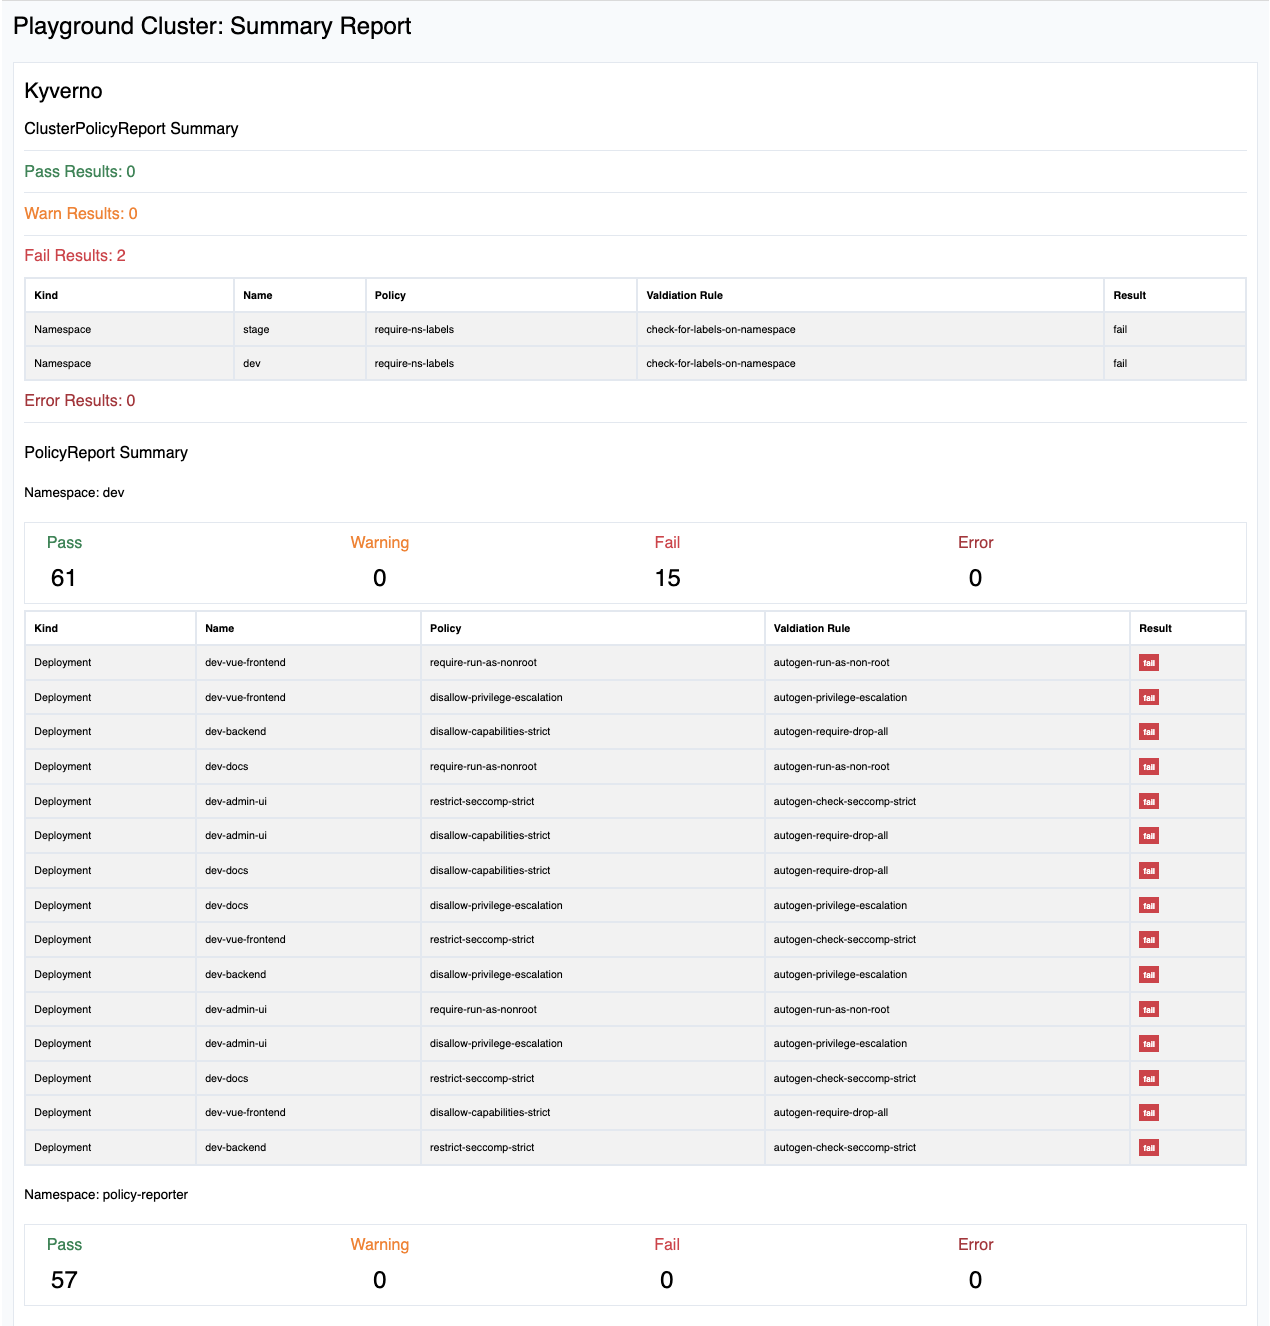
An example email looks like this and gives me as operator an overview about the current status and where I have to take a closer look.
Links
Policy Reporter UI - Multi Cluster Support
While Policy Reporter UI was intended as simple and low-cost alternative to monitoring solutions like Prometheus and Grafana setups, it is used more and more often in production environments. These environments also have different requirements than small playground environments.
One of these requirements was the ability to use a single Policy Reporter UI in a multi cluster environment instead of switching between one dashboard per cluster. This was also perceived as more useful than email reports because of additional details and nearly real-time feedback for changes.
This user request has been addressed with version 1.6.0 of the Policy Reporter UI, adding the ability to configure additional Policy Reporter REST APIs from external clusters and switch between them in a single Policy Reporter UI. The results are still strictly divided by clusters, but you can easily and quickly change the preferred API.
Important Note
Be sure that your APIs are not accessible for the outside world! Use tools like VPN, private Networks or internal Network Load Balancer to expose your APIs in a secure way to the UI.
Example
In this scenario we have two clusters. Our Development cluster, named Default, and our K3S Cluster. To get feedback at any time about the current status of our Kyverno validation we decided to use Policy Reporter UI instead of email reports. We want to use a single UI instance instead of switching between two completely different installations.
K3S Cluster
Because we will use our Development cluster to setup the UI, we only need Policy Reporter with the enabled REST API. We also configure an IP for the REST API, which is only available internally, to access our REST API within the Development cluster.
If we also want information about our Kyverno Policies, we can also enable the KyvernoPlugin with the enabled REST API and configure them as well.
rest:
  enabled: true

kyvernoPlugin:
  enabled: true
Development Cluster
Our Development Cluster will host the Policy Reporter UI. So, we need to enable it and configure the K3S Cluster as additional external API.
ui:
  enabled: true

  clusterName: Default # standard name for the API of the current cluster.

  clusters:
  - name: K3S Cluser
    api: http://10.0.0.1 # refers to service/policy-reporter on port 8080 of our K3S Cluster
    kyvernoApi: http://10.0.0.2 # refers to service/policy-reporter-kyverno-plugin port on 8080 of our K3S Cluster
Demo
Links
Metric Customization
The metrics endpoint was designed to provide as much information about PolicyReportResults as possible. This has the downside that it has a high cardinality, by providing one metric per result. To make this more flexible and reduce the metrics to a bare minimum, Policy Reporter version 2.7.0 implemented filters and label customization.
Filters
Filters makes it possible to define exclude or include rules to filter results by status, severities, namespaces, sources and policies.
Label Customization
To reduce the cardinality, it is possible to reduce the number of labels and details. This can be achieved by setting the metrics.mode to custom and define the labels you want under metrics.customLabel. Supported labels are namespace, rule, policy, report, kind, name, status, severity, category and source.
Example
Because we are using Policy Reporter UI for details about our PolicyReportResults, we only want to use metrics for alerting and basic information about failing and error results. So, we define filters for the status we are interested in and reduce the labels to namespace, status, source and policy.
metrics:
  enabled: true
  mode: custom
  customLabels: ["namespace", "policy", "status", "source"]
  filter:
    status:
      include: ['fail', 'error']
Metric Example
Basic metrics with the provided configuration would look like.
# HELP cluster_policy_report_result Gauge of Results by Policy
# TYPE cluster_policy_report_result gauge
cluster_policy_report_result{policy="require-ns-labels",source="Kyverno",status="fail"} 2
# HELP policy_report_result Gauge of Results by Policy
# TYPE policy_report_result gauge
policy_report_result{namespace="argo-cd",policy="disallow-capabilities-strict",source="Kyverno",status="fail"} 6
policy_report_result{namespace="argo-cd",policy="disallow-privilege-escalation",source="Kyverno",status="fail"} 6
policy_report_result{namespace="argo-cd",policy="require-run-as-nonroot",source="Kyverno",status="fail"} 4
policy_report_result{namespace="argo-cd",policy="restrict-seccomp-strict",source="Kyverno",status="fail"} 6
Links
Observe blocked requests
By default, Kyverno provides (Cluster)PolicyReports on audit validation results. This is useful to gain initial insight into existing resources or to validate common best practices, but you really want to enforce security risk policies.
While you can get PolicyReports about policy enforcement for resources that are already created, you cannot get PolicyReports about blocked requests. In this case, you need to check your Kubernetes events. To simplify this behavior, the KyvernoPlugin of Policy Reporter provides the ability to create (Cluster)PolicyReports based on the mentioned Kubernetes events. This makes it possible to use all the features of the Policy Reporter, such as notifications once a request has been blocked by a validation policy.
By default, this PolicyReports will use Kyverno Event as source to show them separated by the audit validation results. This can be customized.
Example
We are using an enforce policy to block resources created in the default namespace. To observe how often this happens and if anything breaks with this change, we want use slack notifications as soon as a request is blocked in the default namespace.
kyvernoPlugin:
  blockReports:
    enabled: true
    source: 'Kyverno Event'

slack:
  webhook: 'https://hooks.slack.com/services/T0...'
  minimumPriority: 'warning'
  skipExistingOnStartup: true
  source: ['Kyverno Event']
  filter:
    namespaces:
      include: ['default']
Example Report
Generated PolicyReport by the KyvernoPlugin
apiVersion: wgpolicyk8s.io/v1alpha2
kind: PolicyReport
metadata:
  labels:
    managed-by: policy-reporter-kyverno-plugin
  name: polr-ns-default-blocked
  namespace: default
results:
- category: Multi-Tenancy
  message: Using 'default' namespace is not allowed.
  policy: disallow-default-namespace
  properties:
    eventName: disallow-default-namespace.171689c29fa22a8a
    resultID: 917e39a77a23dbdc8a2e5f3d372548bf688ce535
  resources:
  - kind: Pod
    name: nginx
    namespace: default
  result: fail
  rule: validate-namespace
  severity: medium
  source: Kyverno Event
  timestamp:
    nanos: 0
    seconds: 1663668581
summary:
  error: 0
  fail: 1
  pass: 0
  skip: 0
  warn: 0
Links
High Available Setup
To enable scaling and support HA setups in production clusters, Policy Reporter uses leader election to ensure that only one pod sends target notifications. Other features like metrics and REST APIs are load balanced between all pods.
Same goes for the KyvernoPlugin which uses leader election only for the block reports feature, to ensure that only one instance is responsible to create and update PolicyReports for blocked requests.
The Policy Reporter UI does not need leader election because it is stateless except for the Logs page. If you use this feature, it is recommended to use redis as centralized log storage to share the pushed logs between all Policy Reporter UI instances.
Example
To install Policy Reporter via Helm in a HA setup, you simply need to configure the replicaCount for each component higher than one. If you use the Logs page feature, you can also configure a shared redis cache as mentioned above.
replicaCount: 3

kyvernoPlugin:
  enabled: true
  replicaCount: 3
  blockReports:
    enabled: true

ui:
  enabled: true
  replicaCount: 3
  redis:
    enabled: true
    address: redis:6379
Links
- Documentation: Helm Chart - Policy Reporter
- Documentation: Helm Chart - Policy Reporter UI
- Documentation: Helm Chart - Policy Reporter KyvernoPlugin
Policy Reporter CLI
The CLI is currently under development and is an alternative to the Policy Reporter UI. You can list or search your PolicyReportResults with different filter and grouping options. You can use it as kubectl plugin, which makes it possible to switch easily between your clusters.

Example
To check our failing results against the Pod Security Standards, we can list our results with a filter for result and category. We can list them in the current, selected or over all namespaces.
kubectl polr results list --category 'Pod Security Standards (Restricted)' --result fail -n argo-cd
NAMESPACE KIND        NAME                                  POLICY                        RULE                         RESULT
argo-cd   StatefulSet argo-cd-argocd-application-controller disallow-capabilities-strict  autogen-require-drop-all     fail
argo-cd   StatefulSet argo-cd-argocd-application-controller disallow-privilege-escalation autogen-privilege-escalation fail
argo-cd   StatefulSet argo-cd-argocd-application-controller require-run-as-nonroot        autogen-run-as-non-root      fail
argo-cd   StatefulSet argo-cd-argocd-application-controller restrict-seccomp-strict       autogen-check-seccomp-strict fail
argo-cd   Deployment  argo-cd-argocd-dex-server             disallow-capabilities-strict  autogen-require-drop-all     fail
argo-cd   Deployment  argo-cd-argocd-dex-server             disallow-privilege-escalation autogen-privilege-escalation fail
argo-cd   Deployment  argo-cd-argocd-dex-server             require-run-as-nonroot        autogen-run-as-non-root      fail
argo-cd   Deployment  argo-cd-argocd-dex-server             restrict-seccomp-strict       autogen-check-seccomp-strict fail
...
Links
Security Improvements
To use features like push notifications or email reports, it is necessary to configure the related credentials, these are persisted with the whole configuration as a single Secret, by default. This makes it very inconvenient to share your configuration or use GitOps principles, where you want to push your configurations into your Git repositories.
Target Credentials
This can be now achieved with the new secretRef configuration for each target, including channels. This property can reference an already existing secret within the same namespace, with the required credentials instead of configuring them directly.
Depending on the related target, it supports values for host, webhook, username, password, accessKeyID, secretAccessKey and token. It maps the key to the related configuration of the target; the only exception is token. It is used as Authorization header for webhook targets, to support authenticated API access.
Example
Instead of configuring our Slack webhook directly in our values.yaml, we want to use a secretRef to avoid exposing them in our GitHub repository.
Configuration
slack:
  secretRef: 'slack-webhook'
  minimumPriority: 'warning'
  skipExistingOnStartup: true
Referenced Secret
apiVersion: v1
kind: Secret
metadata:
  name: slack-webhook
type: Opaque
data:
  webhook: aHR0cHM6Ly9ob29rcy5zbGFjay5jb20vc2VydmljZXMvVDAuLi4= # https://hooks.slack.com/services/T0...
E-Mail SMTP Credentials
A similar feature is also provided for the SMTP configuration of the email reports. Instead of configure them directly in the values.yaml, you can also configure an already existing secret property. It supports all possible emailReports.smtp keys and it is also possible to mix secret configuration and direct configuration, where secret values have a higher priority than the directly provided ones.
Example
Like the approach for our Slack webhook, we want to do a similar approach for our SMTP configuration.
Configuration
emailReports:
  clusterName: Playground Cluster
  smtp:
    secret: smpt-config
  violations:
    enabled: true
    schedule: "0 0 * * *"
    to: ['devOps@organization.com']
SMTP Secret
apiVersion: v1
kind: Secret
metadata:
  name: smpt-config
type: Opaque
data:
  encryption: c3NsL3Rscw==                    # ssl/tls
  from: cG9saWN5LXJlcG9ydGVyQGdtYWlsLmRl      # policy-reporter@gmail.de
  host: c210cC5zZXJ2ZXIuY29t                  # smtp.server.com
  password: cGFzc3dvcmQ=                      # password
  port: NDY1                                  # 465
  username: cG9saWN5LXJlcG9ydGVyQGdtYWlsLmRl  # policy-reporter@gmail.de
Policy Reporter in action
If you want to see most of the presented features in action, you can also watch Episode 58 | CloudNativeFM with Saim on YouTube.
Conclusion
With amazing community feedback and adoption, Policy Reporter quickly became a great addition to the Kyverno ecosystem. Compared to its early days, it now has a wide range of features and customization options for many different use cases. It also runs in a variety of different clusters these days and works in both small and large production environments.
There is always room for improvement, and I am happy to hear your use case and feedback.